
We had a math-related post on October 11, 2023 in Telegram. Not all the answers we have obtained were correct, which gave us an idea to create an article, dedicated to calculating the vital metrics in affiliate marketing. Don’t get us wrong, we’re doing this not because we doubt your competence, but rather for you to have a convenient reference point. Besides, it’s much easier to communicate with the fellows, when you know exactly what certain Key Performance Indicators mean. Test your knowledge and see if you know them all.
Campaign Analysis Foundations
These metrics should be given by default. Use an affiliate tracker to gather the following data.
Clicks — the nucleus of data analysis. Clicks, or page visits, help to see… everything. Jokes aside, they will help you to determine CPM, CPC, CTR, CR and other key metrics, elaborated on in the following sections.
Singups — a.k.a. leads. These are not paying users yet, but they are on your marketing hook already. They might have subscribed to your newsletter, ordered an eBook, or asked for a discount code.
Conversions — a.k.a. sales. At the end of the day, your job is to sell stuff. So this metric is essential for reverse engineering your funnel, to see which factors might affect its performance: seasonality, land page errors, offer issues.
Bidding Models
Cost Per Click (CPC) = Budget / Number of Clicks

Budget can also be labeled as total ad cost. Usually, your CPC and budget are known in advance, but you can still use this metric to calculate the approximate number of clicks. Knowing CPC is the basic step in planning your campaigns. RollerAds uses CPC (SmartCPC) to monetize Push-Notifications and In-Page Pushes.
Cost Per Mille (CPM) = Budget / Total Number of Impressions * 1,000
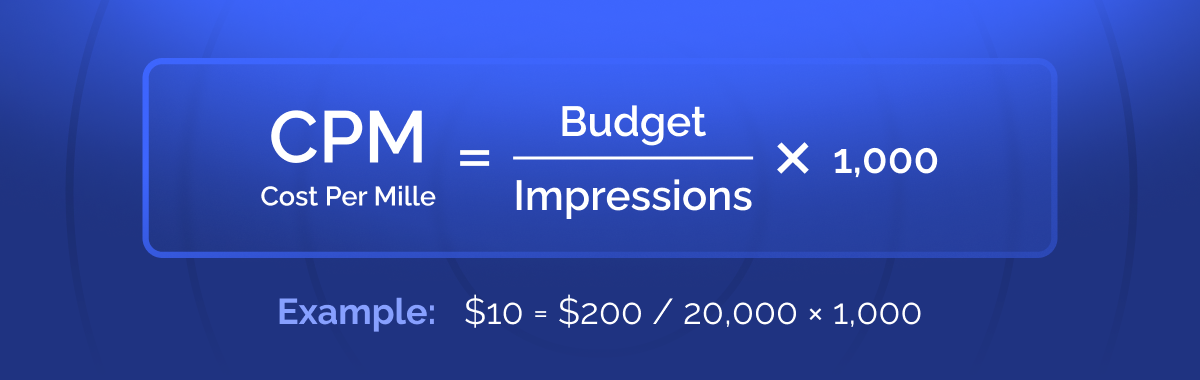
Budget can also be labeled as total ad cost. CPM is another pricing model and a popular alternative to CPC. Unlike CPC, it is one step earlier in a marketing funnel, enabling you to save on cost, if you know how to engage the user. Otherwise, you are more likely to overspend. RollerAds uses CPM (SmartCPM) to monetize OnClicks, a.k.a. PopUnders.
Campaign Performance
Click-Through Rate (CTR) = Number of Clicks / Total Number of Impressions × 100%
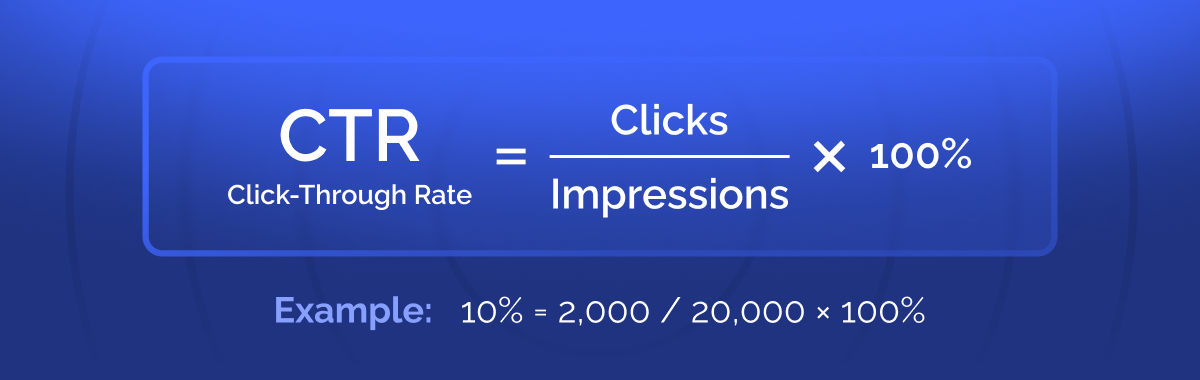
High CTR indicates your ad attractiveness — the users open them willingly. In this case, CPM is more lucrative, as it allows saving on costs. If CTR is low, you are better off with CPC.
Conversion Rate (CR) = Number of Purchases / Number of Clicks × 100%
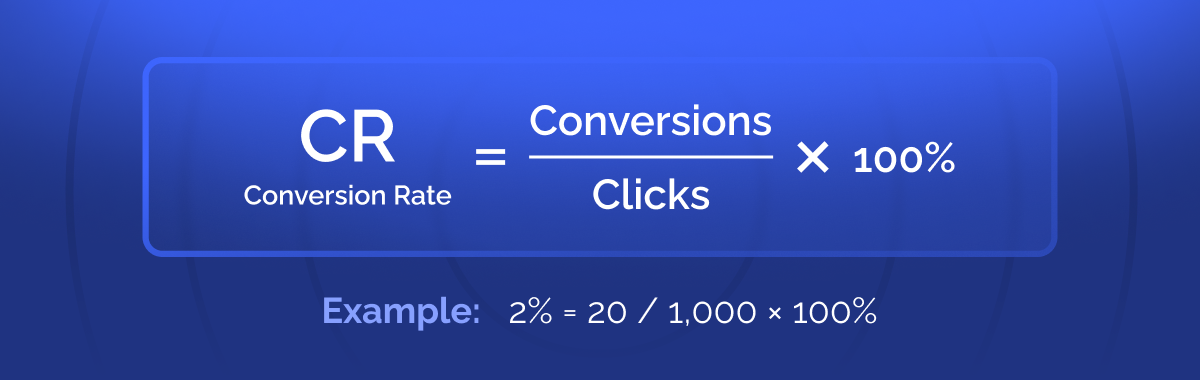
CR indicates how many users of yours are converted, i.e., make a purchase. As a rule of a thumb, everything above 0.5–1% is a good result. CR can also be labelled as Pay Per Click (PPC) Conversion Rate.
Approval Rate (AR) = Leads Approved / Leads in Total × 100%
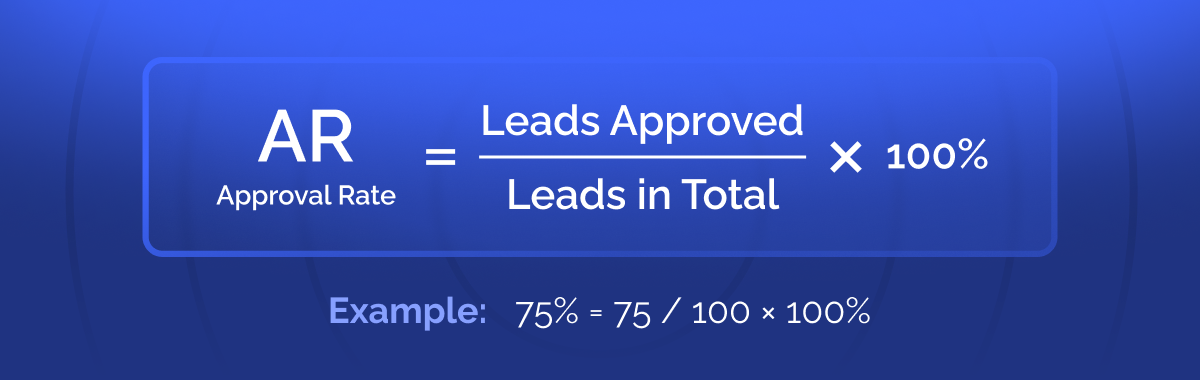
Approval rate is the percentage of leads, confirmed by an advertiser. As an affiliate, you will be paid out for approved-only leads. This creates the incentive to work on the quality of traffic, besides blunt volume increasing.
Return On Investment (ROI) = (Revenue – Cost of the Campaign) / Cost of the Campaign × 100%

This metric shows how much you can increase your capital by investing into the offer. In our case, any sum you take is multiplied by 1.33. Of course, this is a rough approximation, because there are caps, ad fatigue, and other factors, which can interfere with the value.
Earnings Per Click (EPC) = Revenue / Total Clicks

This metric approximates how much you earn whenever someone clicks on your affiliate link. It can be applied not just to a specific offer, but to your campaign list in general — in this case, the metric will show how much you earn whenever one of your links is clicked.
Return On Ad Spent (ROAS) = Revenue / Cost of the Campaign

An alternative approach to EPC, this metric displays how much money you make per every $1 spent. Oftentimes, ROAS is confused with ROI. The former is expressed as ratio, while the latter deals with percentage. ROAS is more handy for a specific ad, to see if it brings results. ROI is more useful for a whole campaign, to see how profitable it is.
Average Order Value (AOV) = (Revenue / Number of Orders)
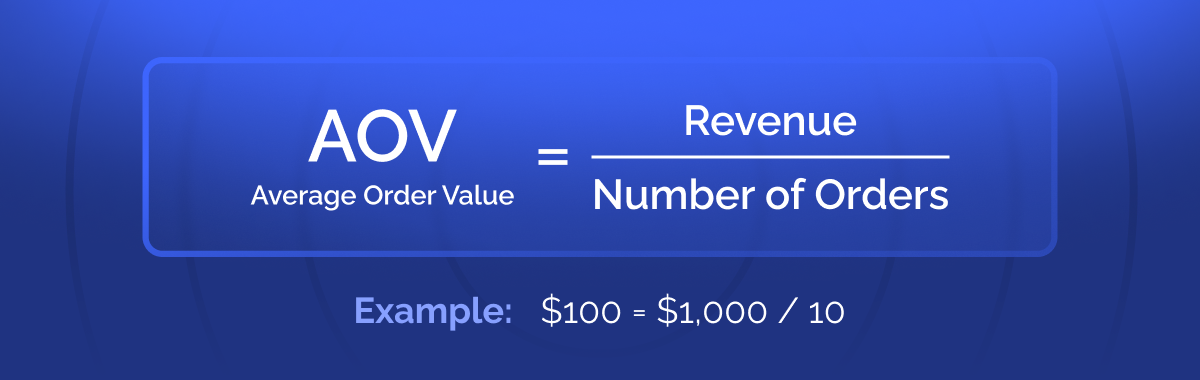
What’s good at bringing in the users, who are for discounts only and then bounce? Your ideal customer is a VIP, who keeps coming back. Basket value, a.k.a. AOV, helps to determine how good you are at retaining your customers.
Customer Acquisition Cost (CAC) = (Cost of Sales + Cost of Marketing) / Clients acquired)
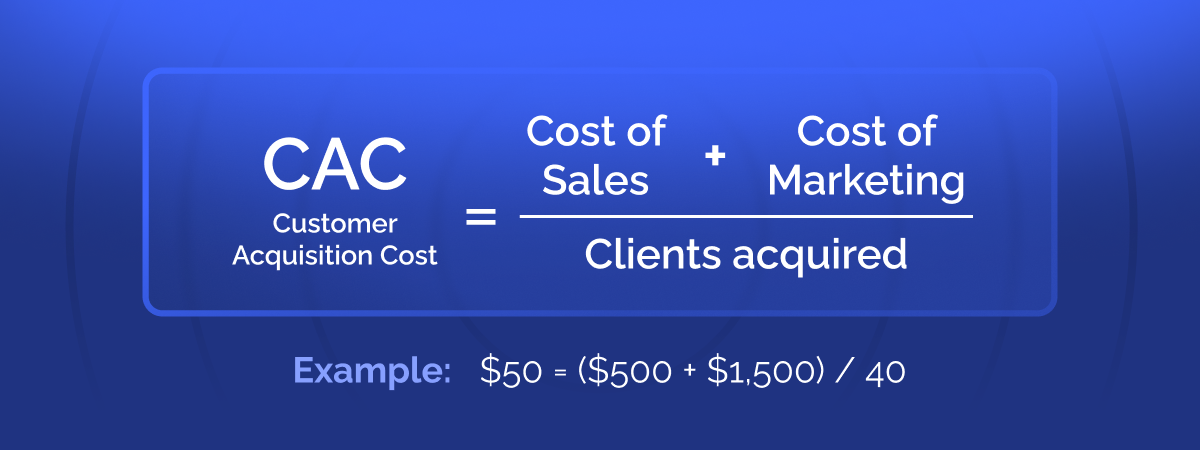
CAC shows how much money you need to spend to acquire one more customer. Business, affiliate marketing included, is all about growth, and your customer base should grow as well. But it has to grow reasonably, without busting your budget. CAC should not be confused with CPA, as the former is applied to measure the cost of acquiring a paying user, while the latter measures the cost of acquiring a lead.
Cost Per Action (CPA) = (Total Cost / People Acquired)
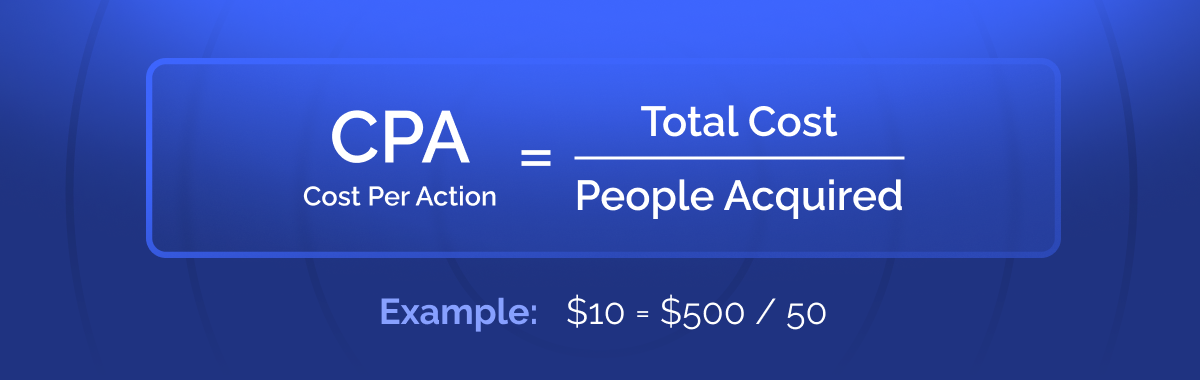
CPA can also stand for Cost Per Acquisition. Cost Per Action is a broader term and a payout model. The actual action can be sales or form submissions, which are paid out by brands. In a utopian world, this metric shows how much you get for every new lead or customer. But make sure not to forget about the AR, since all your leads are to be confirmed first, and some are bound to bounce.
Setbacks but not Failures
Chargeback Rate = Chargebacks / Transactions × 100%
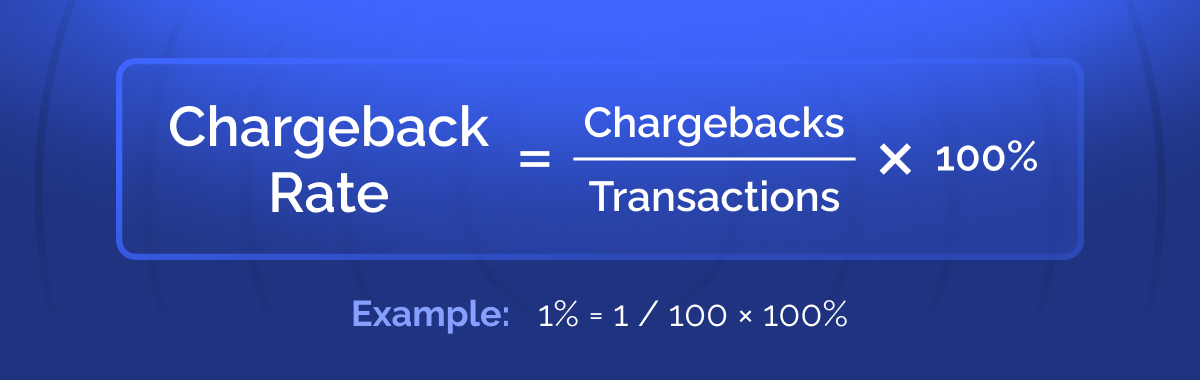
It is a fraud-prevention metric, indicating how many timers customers requested to be refunded. Sometimes the product might malfunction indeed, but more often it indicates that there is something off with ad campaigns, for instance, the users are misled. Chargeback ratio of 1% or more is a bad omen for your campaign.
Unsubscribe Rate = Unsubscribers / Delivered Messages × 100%
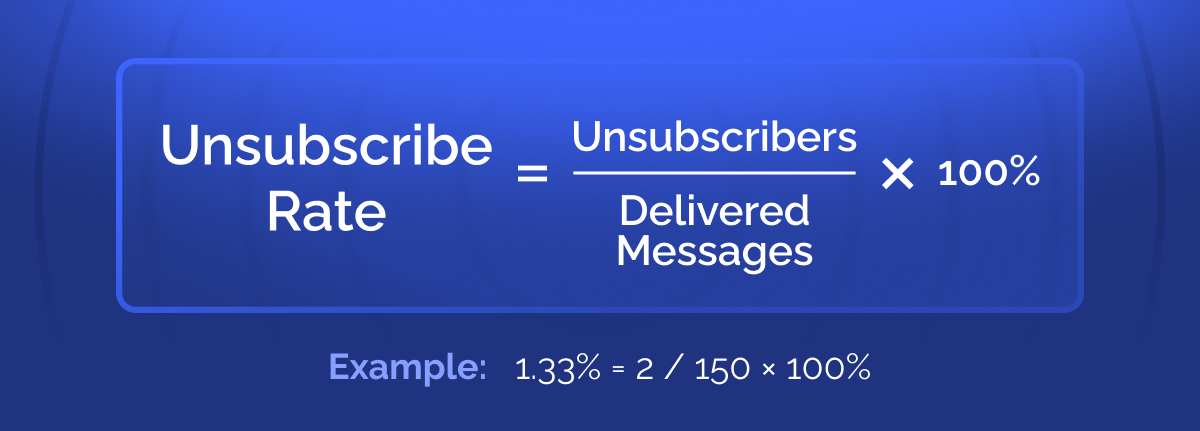
Unsubscribing is inevitable, but you still have to pay attention and keep it in check if you don’t want to lose your precious user base. If this metric goes above 1%, then check if your content meets the users’ expectations, is easy to page-scan, and is delivered to the right audience segment. Don’t forget to personalize your email newsletters.
Bounce Rate (BR) = Single-Page Visits / Total Visits × 100%
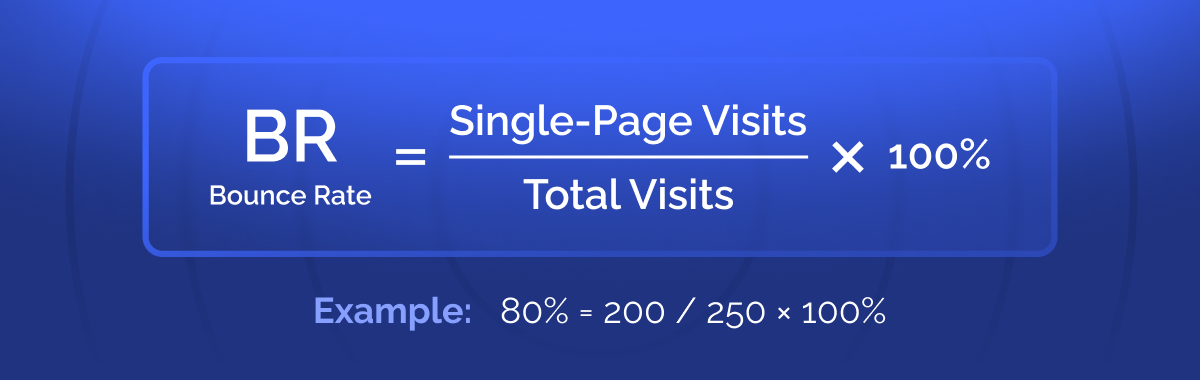
The BR in our example might look like a complete disaster, but bear with us… Google treats all single-page visits as a bounced user. It makes sense, the user got hooked, clicked the link, felt mislead and bounced. However, if you have a single-page website, e.g., doorway, you are bound to have only single-page visits. Still, the BR is a good indicator that something is off, it’s just not flawless.
Conclusion
Hopefully, all the metrics we’ve compiled for you will serve you as a good memo. Did you know them all and, more importantly, how to calculate them? Let us know by dropping a line. RollerAds does work hard, but this adjective is applicable to our partying too. Our partners are like BFF to us, which is why we talk about anything, not only work.